Received: Fri 18, Aug 2023
Accepted: Wed 06, Sep 2023
Abstract
Objective: Use of head and neck coils through a 3.0T high resolution magnetic resonance imaging (HRMRI) scanner to scan and analyze extra cranial carotid artery plaque components for its nature, composition, stability, wall thickness, and lumen stenosis. Methods: Ten patients (3 females and 7 males) with 50-99% stenosis of the carotid artery due to atherosclerotic plaque formation were used in this study. They were selected from a pool of hospitalized patients at a university medical center between May and November of 2017. Gadodiamide was injected to contrast the magnetic resonance imaging (MRI) scan image. This was then imported into the carotid artery plaque imaging analysis software for evaluation. Results: Analytical results of HRMRI analysis of plaque stratification in patients with right carotid artery plaques: area unit of mm2 - levels 4 through 7 showing 0 because the areas had only carotid artery without plaque components. Conclusion: The 3.0T HRMRI scanner can accurately analyze carotid artery plaque composition, morphology, and the percentage of stenosis. This technique maybe used as an atraumatic non-radiation study to assess the severity and stability of carotid artery plaques, and in the prediction of risks for embolic stroke.
Keywords
HRMRI, carotid artery, vulnerable plaque, embolic stroke
1. Introduction
Cerebro-vascular accident (CVA), also known as a stroke is a serious occurrence affecting millions of people across the globe. Composition of atherosclerotic plaque in the carotid artery is the principal risk factor affecting plaque vulnerability and subsequent thromboembolic events such as an embolic stroke [1]. Non-invasive plaque imaging techniques can help assess the risk stratification of clinical treatment. High-resolution magnetic resonance imaging (HRMRI) has many advantages in the magnetic resonance imaging of carotid artery plaques in vivo [2]. HRMRI is widely regarded as the core technique available today to identify lipid necrosis of plaques in the human carotid artery [3]. This technique has the characteristics of a high frequency coil array, high resolution, large longitudinal coverage, and deep penetration [4-6]. Therefore, it has become an ideal tool in this type of study. Currently, the use of HRMRI for carotid artery plaque stratification analysis is inadequate. The present study further analyzes plaque composition, morphology, wall thickness and the rate of lumen stenosis using HRMRI.
2. Data and Methods
2.1. General Information
Seventeen patients with carotid artery stenosis caused by plaque were initially selected from our hospital between May and November of 2017 for this study. All patients showed a stenosis rate of 50-99% prior to admission. A total of 10 patients met the inclusion criteria for this study consisting of 3 females and 7 males with an average age of 62 years.
2.2. Previous Medical History
Cerebral infarction, coronary heart disease, hypertension grade 3 (very high-risk group), diabetes mellitus type 2, bone, and joint catheterization. The average blood pressure and heart rate were 143-194 / 96-122 mm Hg and 61-103 beats per minute respectively. There was no drug history.
2.3. Cases and Methods of Analysis
One case which passed the pre-experiment stage was later excluded due to the poor image quality (mainly due to the blurring of images caused by patient movement and other un-cooperative actions of the patient), while another was excluded due to the destruction of tissue samples in the process of removal. A third case was excluded because the patient had previously had coronary stent implantation. A fourth case was excluded because the patient had vertebral artery stent implantation (post-stenting follow-up instructions do not recommend MRI). Three other cases were excluded since the inspection process had adjustments to the magnetic resonance sequence. The final exemption group therefore had 10 patients.
Using head and neck coil (C Spine + Neck 24) through a GE discovery MR750W, a 3.0T HRMRI scanner was used to scan an extra-cranial carotid artery plaque. Gadodiamide (Trade Name: OmniscanTM, Shanghai GE Pharmaceutical, Shanghai, China; specifications: 15 ml / injection) was used to contrast the MRI scan image. This image was imported into the carotid artery plaque imaging analysis software (Scanning software source: Beijing Qingying Huakang Company Limited; picture technical guidance team: Tsinghua Center for Bio-Medical imaging research. Social Credit Code: 91110108MA007BON30). Tsinghua center for bio-medical imaging research was responsible for the technical guidance of computer imaging processing. All patients signed the written informed consent form which was previously approved by the Second Clinical Medical College Review Committee of Shanxi Medical University, China.
2.4. Layered Patch Method
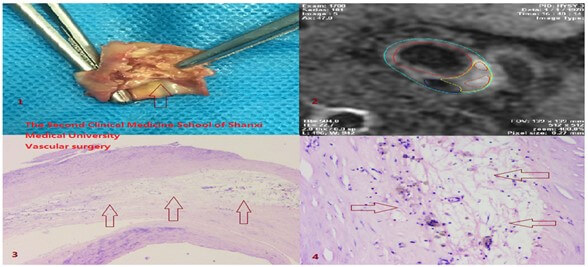
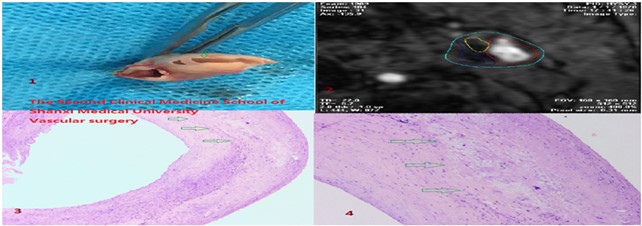
For each patient, the carotid bifurcation was tag lined from distal to proximal, labeled as +8 to -7, with a spacing of 2 mm. Each patient can get 16 data layers and 160 data line markings. When scanning the extra-cranial carotid artery, it was ensured that all MRI scan sites covered the entire carotid plaque. Since some layers only had carotid artery components without plaque components, 104 labeled lines were obtained. Each layer of data consisted of 2-5 component data, such as the lumen (lumen), tube wall (Tube wall: TW lipid core: LC) (Calcification: Ca), calcification, intra-plaque hemorrhage (Intra-plaque hemorrhage: IPH) and the corresponding component size, lumen stenosis rate (Figures 1-3).
A score of 2 or higher have image quality. Image analysis software was used to draw the inner and outer boundary, to draw the arterial morphology index, record the lumen area, wall area, total vessel area, normalized index (wall to wall area divided by the total vessel area) and record the average thickness, and other relevant data.
Based on our clinical experience, there were no strict boundaries between score 3 and score 4 images. Speed of blood flow, respiratory rate and neck thickness can all affect the individual’s score. Both score 3 and score 4 images meet the diagnostic requirements. In clinical practice, when the distance between the carotid artery and the skin is greater than 4 cm, the image will produce a large artifact. If the blood flow velocity is moderate, the respiratory control is good, and the vascular position depth is suitable, then an image of excellent quality (such as a score 4 image) will be obtained (Tables 1 & 2) [7].
TABLE 1: Final
determination of the HRMRI sequence was as follows: OAx FS 3D-TOF-MRA, OAx FS
CUBE T1, OAx FS T2 FSE, AX BRAVO, OCor FS CUBE T1, OAx FS T1 FSE+C, OCor FS
CUBE T1+C. The specific scanning parameters were as follows:
|
|
TRms |
TEms |
FoVcm2 |
MAT |
NEX |
STmm |
SSmm |
BDkHz |
ST |
|
OAx fs
3D-TOF-MRA |
22 |
5.7 |
16*16 |
352*192 |
1 |
2.0 |
-1.0 |
31.2 |
02:55 |
|
OAx fs CUBE T1 |
666 |
22.6 |
14*14 |
256*256 |
4 |
2.0 |
0.0 |
15.6 |
07:44 |
|
OAx fs T2 FSE |
4265 |
89.7 |
14*14 |
256*224 |
6 |
2.0 |
0.0 |
12.5 |
06:54 |
|
AX
BRAVO |
8.5 |
3.3 |
20*20 |
256*256 |
3 |
2.0 |
-1.0 |
31.2 |
05:14 |
|
OCor fs CUBE T1 |
400 |
15.7 |
20*20 |
256*256 |
5 |
1.2 |
0.0 |
41.7 |
04:53 |
|
OAx fs T1
FSE+C |
666 |
22.6 |
14*14 |
256*256 |
4 |
2.0 |
0.0 |
15.6 |
07:44 |
|
OCor fs CUBE
T1+C |
400 |
15.7 |
20*20 |
256*256 |
5 |
1.2 |
0.0 |
41.7 |
04:53 |
TABLE 2: Classification
of HRMRI image quality fraction [7].
|
Score |
Level |
Quality
Description |
|
1 |
Poor Quality |
Unrecognized arterial wall and luminal edge |
|
2 |
Adequate Quality |
Seen in the arterial wall but partly obscure in
composition and structure |
|
3 |
Good Quality |
Minimal motion or flow artifact with clear
vascular walls and luminal boundaries. |
|
4 |
Excellent Quality |
No artifact, detailed description of tube wall
structure and plaque composition. |
3. Results
3.1. HRMRI Carotid Plaque Image Analysis Results
This experiment used HRMRI to analyze 10 cases of carotid artery atherosclerosis patients (a total of 20 carotid arteries), according to the American Heart Association MRI modified type [8] (magnetic image: red boundary represents the artery lumen, the green boundary the lumen outer wall, the blue border represents calcification, and the yellow boundary the lipid core. The red boundary within the lipid core represents intra-plaque hemorrhage) (Table 3).
TABLE 3
|
Type |
State
Description |
Development
Stage |
|
I-II |
Stable Plaque |
Nearly normal wall thickness and no calcification |
|
III |
Increased intima media thickness or smaller
eccentric plaques |
|
|
IV-V |
Vulnerable Plaque |
The intact fibrous cap covered the lipid rich core;or
Necrotic plaques and possible calcification |
|
VI |
Complicated plaques with surface rupture, bleeding
or thrombosis |
|
|
VII |
Stable Plaque |
Calcified plaque |
|
VIII |
Stable Plaque |
Fibrous plaques without lipid core |
Analytical results of HRMRI analysis of plaque stratification in patients with right carotid plaques; area unit of mm2 (levels 4 through 7 showing 0 because the areas had only carotid artery without plaque components) (Table 4).
TABLE 4
|
Case
number |
Analysis
side |
Level |
Ca |
LC |
IPH |
|
750969 |
Left |
-3 |
0.00 |
16.30 |
0.00 |
|
750969 |
Left |
-2 |
0.00 |
22.58 |
0.00 |
|
750969 |
Left |
-1 |
0.00 |
32.00 |
18.89 |
|
750969 |
Left |
0 |
2.63 |
37.11 |
17.56 |
|
750969 |
Left |
1 |
0.00 |
23.28 |
14.78 |
|
750969 |
Left |
2 |
0.00 |
24.95 |
0.00 |
|
750969 |
Left |
3 |
0.00 |
14.69 |
0.00 |
|
750969 |
Left |
4 |
0.00 |
3.31 |
0.00 |
|
750969 |
Left |
5 |
0.00 |
0.00 |
0.00 |
|
750969 |
Left |
6 |
0.00 |
0.00 |
0.00 |
|
750969 |
Left |
7 |
0.00 |
0.00 |
0.00 |
3.2. Materials and Methods
A single plaque was selected from a carotid endarterectomy surgery patient. During pre-experiment, obtain plaque slice by placing a horizontal cut that was perpendicular to the vertical axis of the plaque, so that under microscope the slice would clearly show the lumen structure of the plaque. Observed plaque component structure and morphology to achieve the expectation of pre-experimentation. Measure each plaque for the diameter and width, mark the carotid bifurcation 0, from the furthest to the nearest mark in each plaque; tag line range of +8 to -7. Tag lines start from the carotid artery bifurcation. Plaque slices were cut 2 mm in space between distal and proximal ends, and then fixed in 10% neutral formaldehyde solution. After 24 hours, perform decalcification, slicing, HE staining and other processing; the final slices (tag lined) each has a thickness of about 3-5 um with an average of 4 um. The slices with a clear image were selected, and the cross-sectional area of each component in the plaque was measured by a microscopic micrometer. The unit was mm2.
The sample was contracted during fixation and processing. We measured the average length and width of each patch sample before and after fixation. It was found that the length and width of the patch were reduced by about 27% and 12% respectively. The complex lesions of each sample had different degrees of reduction from different components which may change the size of the slice, making it difficult to accurately match. We calculated lipid area / vessel area, because of reduced matching error analysis.
The use of micrometer ruler: measuring the corresponding area of the components in the plaque, using the vernier caliper for determination. Two axis vernier calipers in 2D space to mark samples vertically and horizontally. Each vernier caliper has 100 small squares and 10 large squares while each large square consisted of 10 small squares. The length of the distance represents 1 (unit um, * on behalf of the eyepiece magnification (Table 5). The gross specimen, the marking form and the lumen shape under the microscope are shown in (Figure 4).
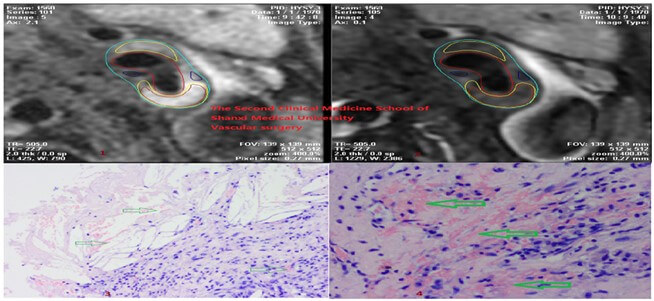
HRMRI and pathological analysis of carotid plaques contain components, properties, morphology, stenosis rate and other image comparison. The pathological features and pathological findings of lipid necrosis core in HRMRI images are seen in (Figure 5). In the early stage of atherosclerosis, macrophage lipoprotein after the formation of foam cells and accumulation in the intima, the foam cell death and the release of lipid, lipid core formed a soft, unstable and necrosis. Characterized by soft porridge, lack of collagen support, and the formation of a significantly reduced number of non-vascular areas. This plaque is V type vulnerable plaque. The appearance of fibrous cap (fibrous tissue) on HRMRI images and pathological and microscopic findings (Figure 6).
TABLE 5
|
Eyepiece
multiplier |
2* |
4* |
10* |
20* |
40* |
60* |
|
Length (um) |
50 |
25 |
10 |
5 |
2.5 |
1.6 |
The surface of a vascular plaque is usually covered with a fibrous cap that separates plaque and blood flow. The fibrous cap contains smooth muscle cells adjacent to collagen and basement membrane. The formation of smooth muscle cells is the result of interaction between collagen and T cells and monocytes. MRI imaging studies suggest that plaque cap status and lipid content are closely related to systemic cardiovascular outcomes, and carotid plaque vulnerability may be a new surrogate marker of atherosclerosis risk [9]. Therefore, the status of fiber cap is one of the predictors of stroke risk. This plaque is VI type vulnerable plaque. Neovascularization (and hemorrhage within plaques). Imaging findings and pathological gross microscopic findings of neovascularization (Figure 7).
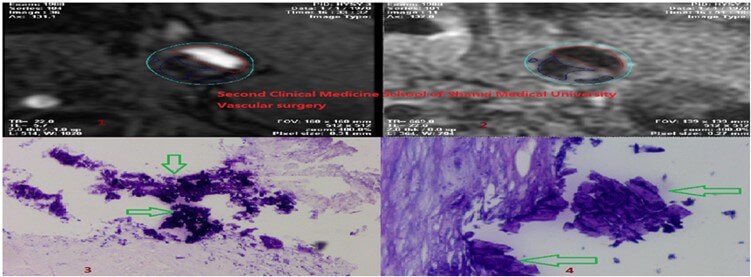
Neovascularization is very fragile, easy to expose and express various adhesion molecules, which may cause blood plasma protein, red blood cells and inflammatory cells to overflow, triggerintra-plaque hemorrhage. MRI analysis showed that the risk of ischemic events was higher in patients with higher luminal dilatation and higher T1 signal intensity [10]. This plaque is VI type vulnerable plaque. Calcification (calcified nodules) image manifestations and pathological gross and microscopic findings (Figure 8). The diversity of calcification in MRI signal is due to the composition, content and distribution of calcium salt crystals. MRI inhibits calcium signaling and is conducive to the appearance of micro lesions. Some high signal calcified nodules come from calcium crystals with rough surface structure and irregular morphology, such as calcium hydroxide, tricalcium phosphate and so on [11]. Near the lumen and inside the fibrous cap, calcification may break the fibrous cap, leading to plaque rupture [12]. The plaque is VII type stable plaque.
3.3. Evaluation of Carotid Artery Stenosis Rate by HRMRI
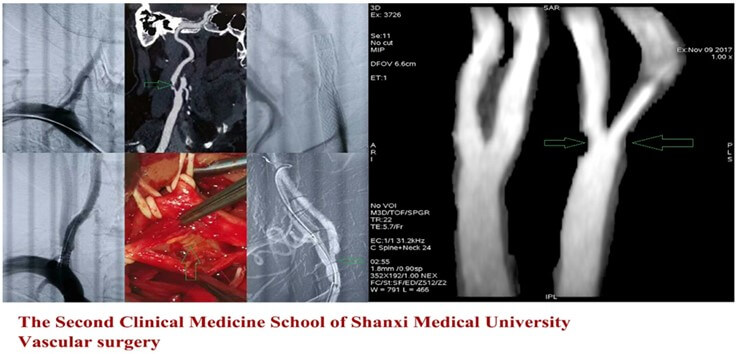
Magnetic resonance imaging of plaques showed good consistency between carotid stenosis and DSA [13]. Color ultras of the selected patients showed: the rate of carotid artery stenosis (plaque induced) was about 30%-90%, head and neck CTA examination corresponding to each patient showed carotid artery stenosis rate was 30-90%, the neck vascular MRI stenosis rate was about 30%-90%. Among the enrolled patients, the stenosis rate of MR was compared with that of CT and B ultrasound, and all 10 cases were consistent (Figure 9).
3.4. Data Analysis and Statistics
Comparison of HRMRI and pathological section in judging whether there is any component in plaque (Table 6). The two tables represent the data results of the same patient. The letter Y in the table represents yes, indicating the presence of this component in the plaque; N represents no, and no evidence exists in the plaque; the letter U stands for unrecognized, indicating that HRMRI is unable to recognize the component. t-test was used to compare the differences between HRMRI and histopathology in determining the lumen and wall area (mm2) (Tables 7 & 8).
TABLE
6
|
Analysis side |
Analysis basis |
Ca |
LC |
IPH |
Inflammatory Cells |
Marking line |
|
Left side |
HRMRI |
N |
Y |
N |
N |
-3 |
|
Pathology |
||||||
|
HRMRI |
N |
Y |
N |
N |
-2 |
|
|
Pathology |
||||||
|
HRMRI |
N |
Y |
Y |
U |
-1 |
|
|
Pathology |
Y |
|||||
|
HRMRI |
Y |
Y |
Y |
U |
0 |
|
|
Pathology |
Y |
|||||
|
HRMRI |
N |
Y |
Y |
N |
1 |
|
|
Pathology |
||||||
|
HRMRI |
N |
Y |
N |
N |
2 |
|
|
Pathology |
||||||
|
HRMRI |
N |
Y |
N |
N |
3 |
|
|
Pathology |
||||||
|
HRMRI |
N |
Y |
N |
N |
4 |
|
|
Pathology |
TABLE 7
|
Lumen
(π=3.14) |
|||||
|
Case
number |
Analysis
side |
Level |
HRMRI |
Pathology |
Radius |
|
753815 |
Right |
-8 |
47.45 |
44.87 |
3.78 |
|
753815 |
Right |
-7 |
45.94 |
43.45 |
3.72 |
|
753815 |
Right |
-6 |
43.42 |
38.69 |
3.51 |
|
753815 |
Right |
-5 |
28.76 |
23.06 |
2.71 |
|
753815 |
Right |
-4 |
24.26 |
21.88 |
2.64 |
|
753815 |
Right |
-3 |
25.44 |
23.57 |
2.74 |
|
753815 |
Right |
-2 |
33.18 |
30.96 |
3.14 |
|
753815 |
Right |
-1 |
31.08 |
28.64 |
3.02 |
|
753815 |
Right |
0 |
28.01 |
25.86 |
2.87 |
|
753815 |
Right |
1 |
12.44 |
9.72 |
1.76 |
|
753815 |
Right |
2 |
13.55 |
11.46 |
1.91 |
|
753815 |
Right |
3 |
20.92 |
13.98 |
2.11 |
|
753815 |
Right |
4 |
20.06 |
12.06 |
1.96 |
|
753815 |
Right |
5 |
10.66 |
8.45 |
1.64 |
|
753815 |
Right |
6 |
11.63 |
8.97 |
1.69 |
|
753815 |
Right |
7 |
9.85 |
7.45 |
1.54 |
|
|
T statistics |
P |
0.45725341 |
||
TABLE 8
|
Tube
Wall (π=3.14) |
|||||
|
Case
number |
Analysis
side |
Level |
HRMRI |
Pathology |
Radius
(Contain tube wall) |
|
753815 |
Right |
-8 |
22.52 |
17.87 |
4.47 |
|
753815 |
Right |
-7 |
28.20 |
23.86 |
4.63 |
|
753815 |
Right |
-6 |
30.48 |
26.32 |
4.55 |
|
753815 |
Right |
-5 |
45.95 |
42.81 |
4.58 |
|
753815 |
Right |
-4 |
52.96 |
47.77 |
4.71 |
|
753815 |
Right |
-3 |
66.60 |
62.31 |
5.23 |
|
753815 |
Right |
-2 |
73.82 |
66.81 |
5.58 |
|
753815 |
Right |
-1 |
73.87 |
64.29 |
5.44 |
|
753815 |
Right |
0 |
85.84 |
84.18 |
5.92 |
|
753815 |
Right |
1 |
75.17 |
70.99 |
5.07 |
|
753815 |
Right |
2 |
69.42 |
62.10 |
4.84 |
|
753815 |
Right |
3 |
60.17 |
58.06 |
4.79 |
|
753815 |
Right |
4 |
52.99 |
44.12 |
4.23 |
|
753815 |
Right |
5 |
47.36 |
37.37 |
3.82 |
|
753815 |
Right |
6 |
29.33 |
22.98 |
3.19 |
|
753815 |
Right |
7 |
24.93 |
21.38 |
3.03 |
|
|
T statistics |
P |
0.46578522 |
||
HRMRI and pathology were used to determine the cross-sectional area of the lumen and the wall of the carotid plaque (the wall area was calculated as the difference between the outer wall border and the lumen area): t-test excel statistical method was used. After measuring the lumen area, the P values of each patient were statistically greater than 0.05; after measuring the wall area of the tube, the P values of each patient were statistically greater than 0.05. There was no statistical difference between the two groups in measuring lumen and wall area. Chi square test was used to compare the differences between HRMRI and pathological slices in judging the composition of plaques: (Tables 9-11).
TABLE 9
|
IPH |
Existence |
No existence |
Total |
Detection rate |
|
HRMRI |
24 |
134 |
158 |
15.19% |
|
Pathology |
30 |
130 |
160 |
18.75% |
|
Total |
54 |
264 |
318 |
|
|
|
|
|
|
|
|
Actual Value |
24 |
134 |
|
|
|
|
30 |
130 |
|
|
|
|
|
|
|
|
|
|
|
|
|
|
|
Theoretical Value |
26.83019 |
131.16981 |
|
|
|
|
27.16981 |
132.83019 |
|
|
|
|
|
|
|
|
|
Chi-square Value |
0.71472 |
|
|
|
|
Free degree |
1 |
|
|
|
|
P value |
0.3969915 |
|
|
|
TABLE 10
|
Calcification |
Existence |
No existence |
Total |
Detection rate |
|
HRMRI |
74 |
84 |
158 |
46.84% |
|
Pathology |
82 |
78 |
160 |
51.25% |
|
Total |
156 |
162 |
318 |
|
|
|
|
|
|
|
|
Actual Value |
74 |
84 |
|
|
|
|
82 |
78 |
|
|
|
|
|
|
|
|
|
|
|
|
|
|
|
Theoretical Value |
77.50943 |
80.49057 |
|
|
|
|
78.49057 |
81.50943 |
|
|
|
|
|
|
|
|
|
Chi-square Value |
0.43107585 |
|
|
|
|
Free degree |
1 |
|
|
|
|
P value |
0.511461517 |
|
|
|
TABLE 11
|
Lipid core |
Existence |
No existence |
Total |
Detection rate |
|
Pathology |
82 |
78 |
160 |
51.25% |
|
HRMRI |
74 |
84 |
158 |
46.84% |
|
Total |
156 |
162 |
318 |
|
|
|
|
|
|
|
|
Actual Value |
82 |
78 |
|
|
|
|
74 |
84 |
|
|
|
|
|
|
|
|
|
|
|
|
|
|
|
Theoretical Value |
78.49057 |
81.50943 |
|
|
|
|
77.50943 |
80.49057 |
|
|
|
|
|
|
|
|
|
Chi-square Value |
0.43107585 |
|
|
|
|
Free degree |
1 |
|
|
|
|
P value |
0.51146152 |
|
|
|
Comparison of HRMRI and pathology in evaluating the carotid plaque components: Use application of chi-square test statistics table four - in the detection of intra-plaque hemorrhage, calcification, and lipid core HRMRI and pathological results of chi square values were 0.71, 0.43 and 0.43, less than 3.84, indicating that the actual results matched the theoretical assumptions. The P values were 0.397, 0.511 and 0.511, respectively, all greater than 0.05, indicating that there was no significant difference between the two groups in judging the composition of plaque.
Kappa test to compare the consistency between HRMRI and pathological examination of plaque components: (Table 12-14). The kappa values of lipid core and plaque hemorrhage were 0.7996 and 0.778, all greater than 0.75, indicating that HRMRI had good consistency with pathological sections. The kappa value of calcification was 0.699 (between 0.40 and 0.75), indicating the consistency between HRMRI and pathological sections. t-comparison of carotid stenosis rate between carotid artery HRMRI and CTA (Table 15).
TABLE 12
|
|
IPH |
|
Pathology |
|
|
|
|
Positive |
Negative |
Total |
|
|
Positive |
22 |
2 |
24(a+b) |
|
HRMRI |
Negative |
8 |
128 |
136(c+d) |
|
|
Total |
30(a+c) |
130(b+d) |
160(n=a+b+c+d) |
|
|
|
|
|
|
|
|
Po |
(a+d)/n |
|
|
|
|
Pe |
[(a+b)(a+c)+(c+d)(b+d)]/n2 |
||
|
|
|
|
|
|
|
|
Formula |
Kappa=(Po-Pe)/1-Pe |
|
|
|
|
Kappa |
0.778 |
|
|
TABLE 13
|
|
Ca |
|
Pathology |
|
|
|
|
Positive |
Negative |
Total |
|
|
Positive |
64 |
10 |
74(a+b) |
|
HRMRI |
Negative |
14 |
72 |
86(c+d) |
|
|
Total |
78(a+c) |
82(b+d) |
160(n=a+b+c+d) |
|
|
|
|
|
|
|
|
Po |
(a+d)/n |
|
|
|
|
Pe |
[(a+b)(a+c)+(c+d)(b+d)]/n2 |
||
|
|
|
|
|
|
|
|
Formula |
Kappa=(Po-Pe)/1-Pe |
|
|
|
|
Kappa |
0.699 |
|
|
TABLE 14
|
|
LC |
|
Pathology |
|
|
|
|
Positive |
Negative |
Total |
|
|
Positive |
68 |
6 |
74(a+b) |
|
HRMRI |
Negative |
10 |
76 |
86(c+d) |
|
|
Total |
78(a+c) |
82(b+d) |
160(n=a+b+c+d) |
|
|
|
|
|
|
|
|
Po |
(a+d)/n |
|
|
|
|
Pe |
[(a+b)(a+c)+(c+d)(b+d)]/n2 |
||
|
|
|
|
|
|
|
|
Formula |
Kappa=(Po-Pe)/1-Pe |
|
|
|
|
Kappa |
0.7996 |
|
|
TABLE 15
|
Grope |
Surgical
side |
HRMRI |
CTA |
|
1 |
Right |
70% |
50% |
|
2 |
Left |
80% |
75% |
|
3 |
Left |
60% |
50% |
|
4 |
Left |
99% |
99% |
|
5 |
Right |
80% |
75% |
|
6 |
Right |
85% |
75% |
|
7 |
Left |
99% |
99% |
|
8 |
Right |
75% |
70% |
|
9 |
Left |
99% |
70% |
|
10 |
Left |
60% |
50% |
|
|
T Statistics |
P |
0.340912278 |
The selected patients were divided into 10 groups. The rate of stenosis of the carotid artery in the same operation side was compared in each group before and after the operation. t-test showed that the P value was 0.341 (greater than 0.05). There was no statistical difference between the two groups in judging the stenosis rate of carotid artery lumen. However, the average HRMRI analysis showed that the lumen stenosis rate was larger than that of cranial CTA, about 5%-29%.
Due to the irregularity of its composition (lipid core, cholesterol, calcification, intraplaque hemorrhage), pathological appearances of carotid plaque may present as oval, round, triangular, trapezoidal, crescent shaped, or polygon. These features make accurate measurement of carotid lumen area reduction difficult, if not impossible, based on pathological sections. The areas of the lumen were calculated by the formula of circular area. The area of the tube wall is calculated by subtracting the area of the inner diameter circle with the area of the outer circle, and the area of each measuring area is marked by mm2. 160 tag line data were obtained from the selected 10 patients. The HRMRI analysis of plaque components and the areas marked by the tag lines also corresponds to the pathological sections.
The diameter is calculated in terms of the circumference. The red line is the circumference of the tube wall, and the blue line is the circumference of the lumen (Figure 10). The area of the vessel wall is calculated by subtracting the area of the lumen from the area of the outer diameter of the vessel which is marked by mm2: (Table 16).

TABLE 16
|
Tube wall π=3.14 |
||||
|
Case number |
Analysis side |
Pathology |
Radius(contain tube wall) |
Lumen Radius |
|
753815 |
Right |
17.87 |
4.47 |
3.78 |
|
753815 |
Right |
23.86 |
4.63 |
3.72 |
|
753815 |
Right |
26.32 |
4.55 |
3.51 |
|
753815 |
Right |
42.81 |
4.58 |
2.71 |
|
753815 |
Right |
47.77 |
4.71 |
2.64 |
|
753815 |
Right |
62.31 |
5.23 |
2.74 |
|
753815 |
Right |
66.81 |
5.58 |
3.14 |
|
753815 |
Right |
64.29 |
5.44 |
3.02 |
|
753815 |
Right |
84.18 |
5.92 |
2.87 |
|
753815 |
Right |
70.99 |
5.07 |
1.76 |
|
753815 |
Right |
62.1 |
4.84 |
1.91 |
|
753815 |
Right |
58.06 |
4.79 |
2.11 |
|
753815 |
Right |
44.12 |
4.23 |
1.96 |
|
753815 |
Right |
37.37 |
3.82 |
1.64 |
|
753815 |
Right |
22.98 |
3.19 |
1.69 |
|
753815 |
Right |
21.38 |
3.03 |
1.54 |
The results were as follows: the left carotid artery groups: 2 IV type plaques, 2 V type plaques, 4 VI type plaques, and 2 VII type plaques. The right carotid artery groups: 4 IV type plaques, 4 VI type plaques, while 2 showed no plaques. There were 16 carotid arteries with vulnerable plaques in 20 carotid arteries (80%), 2 (10%) carotid arteries with stable plaques, and 2 carotid plaques without plaques. Comparison of the HRMRI pathological analysis in carotid plaque composition (lipid core, calcification, intra-plaque hemorrhage) had no significant difference. HRMRI analysis of intra-plaque hemorrhage and lipid core is better than that of calcification and showed consistency with the pathology. There was no statistical difference between the two methods in the measurement of the lumen and the measurement of wall area of the carotid arteries, but the results of HRMRI analysis were larger than those of pathological measurements, which were about 1.3%-26.7%. Due to the irregular shape of the plaque components in the pathological section, the corresponding area cannot be measured.
4. Discussion
Naghavi and colleagues summarized coronary atherosclerosis in patients with diagnostic criteria of vulnerable plaque, namely active inflammation, thin fibrous cap, and large lipid necrotic core [14]. The surface of the calcified nodules, intra-plaque hemorrhage, and positive remodeling are secondary standards. The advantage of HRMRI is that it does not involve ionizing radiation, non-invasive, visualization of the lumen wall structure, and can repeatedly track the progression or extinction of plaques continuously, providing good contrast among the soft tissues. This test used HRMRI stratified carotid plaque, the plaque composition, plaque morphology, stenosis rate, lumen for qualitative and quantitative analysis, and clear plaque vulnerability, to determine the preoperative endometrial patients underwent carotid endarterectomy if the benefits provide important imaging evidence.
The image quality of the experimental image reached a score of 3 in most cases, while a few reached a score of 4. The reason as ton why not all images reached a score of 4 is analyzed next. The main reason is that the software of MRI equipment cannot be optimized synchronously. This instrument uses 24 channel head and neck joint line instead of the special coil for carotid plaque. The head and neck joint coil is far away from the carotid artery plaque, and the special coil of the carotid artery attaches directly to the skin of the carotid artery, resulting in the image not reaching score 4 quality. In addition, when the sequence is selected, the same sex reaches 1.0 cm × 0.8 cm × 0.8 cm at most; therefore, the scanning time control and image quality cannot reach the requirement of 0.8 cm × 0.8 cm × 0.8 cm, so that part of the image cannot reach score 4.
The secondary reason is that in long term MR examination in middle and old age individuals, a cough can lead to lose focus when capturing the image, resulting in an image quality not reaching a score 4. At the same time, it was found that the MRI instrument could not image the heavy T1 sequence (this sequence was more sensitive to detect the bleeding within the plaque), so it could cause the image quality failed to reach a score of 4.
Through the analysis of plaque composition, this experiment is more detailed and reasonable than the overall analysis of the composition and structure of plaque, avoiding the volume effect. This work described in detail the plaque composition, morphology, and its properties. Concurrently, this work was able to determine the rate of carotid artery stenosis. It also provides further proof that HRMRI can accurately identify the lumen structure, carotid artery plaque composition, and also determine the stability of the plaque. HRMRI measurement results showed good consistency with no significant differences in carotid plaque composition compared to pathological results. Pathological results of the lumen under micrometer measurements of carotid artery plaque, the corresponding pipe measurement results no significant difference between the wall area and HRMRI pathological section under microscope. Recommendation [12] 3.0T high resolution MRI, carotid artery phased array coil, parallel multi contrast imaging analysis plaque.
5. Conclusion
The experiment shows that HRMRI can be used for more detailed analysis of extracranial carotid plaque composition, morphology, and severity of stenosis, rate and other data, and provides an important basis for the image evaluation, patients of carotid artery stenosis disease, plaque morphology and analysis of lumen obstruction.
Conflicts of Interest
None.
Funding
This project was funded by the Division of Advanced Programs of the Human Resources and the Social Security Bureau of Shanxi Province and the Health Department of Shanxi Province of the People’s Republic of China.
Project Number
Shanxi Financial Society (2017) 144-2.
Author Contributions
Concept and design: HD, WT. Analysis and interpretation: HD, WT, TX, JH, QT, PS. Data collection: JH, PS, TL, ML. Writing of the article: HD, WT, SP, WZ. Critical revision of the article: SP, WZ.
REFERENCES
[1] Jin-Er Shu,
Ming-Liang Ying, Xiao-Rong Chen, et al. “Prognostic value of High-Resolution
Magnetic Resonance Imaging in Evaluating Carotid Atherosclerotic Plaque in
Patients with Ischemic Stroke.” Medicine (Baltimore), vol. 96, no.45,
pp. e8515, 2017. View at: Publisher Site | PubMed
[2] M R Lopez
Gonzalez, S Y Foo, W M Holmes, et al. “Atherosclerotic Carotid Plaque
Composition: A 3T and 7T MRI-Histology Correlation Study.” J Neuroimaging,
vol. 26, no.4, pp. 406-413, 2016. View at: Publisher Site | PubMed
[3] C Yuan, L M
Mitsumori, M S Ferguson, et al. “In vivo Accuracy of Multispectral
Magnetic Resonance Imaging for Identifying Lipid-rich Necrotic Cores and
Intraplaque Hemorrhage in Advanced Human Carotid Plaques.” Circulation,
vol. 104, no.17, pp. 2051-2056, 2001. View at: Publisher Site | PubMed
[4] Xiaoqing
Hu, Lei Zhang, Xiaoliang Zhang, et al. “An 8-channel RF Coil Array for Carotid
Artery MR Imaging in Humans at 3 T.” Med Phys, vol. 43, no.4, pp. 1897,
2016. View at: Publisher Site | PubMed
[5] Hyo Sung
Kwak, Seung Bae Hwang, Gyung Ho Chung, et al. “High-Resolution Magnetic
Resonance Imaging of Symptomatic Middle Cerebral Artery Dissection.” Stroke
Cerebrovasc Dis, vol. 23, no.3, pp. 550-553, 2014. View at: Publisher Site | PubMed
[6] Hai-Ong
Lee, Hyo-Sung Kwak, Gyung-Ho Chung, et al. “Diagnostic Usefulness of High-
Resolution Cross-Sectional MRI in Symptomatic Middle Cerebral Arterial
Dissection.” J Korean Neurosurg Soc, vol. 49, no.6, pp. 370-372, 2011.
View at: Publisher
Site | PubMed
[7] Hunter R
Underhill, Vasily L Yarnykh, Thomas S Hatsukami, et al. “Carotid Plaque
Morphology and Composition: Initial Comparison between 1.5- and 3.0-T Magnetic
Field Strengths.” Radiology, vol. 248, no.2, pp. 550-560, 2008. View at:
Publisher
Site | PubMed
[8] Jian-Ming
Cai, Thomas S Hatsukami, Marina S Ferguson, et al. “Classification of Human
Carotid Atherosclerotic Lesions with in vivo Multi-contrast Magnetic Resonance
Imaging.” Circulation, vol. 106, no.11, pp. 1368-1373, 2002. View at: Publisher Site | PubMed
[9] Jie Sun,
Xue-Qiao Zhao, Niranjan Balu, et al. “Carotid Plaque Lipid Content and Fibrous
Cap Status Predict Systemic CV Outcomes: The MRI Sub-study in AIM-HIGH.” JACC
Cardiovasc Imaging, vol. 10, no.3, pp. 241-249, 2017. View at: Publisher
Site | PubMed
[10]
Yoshitaka Kurosaki, Kazumichi Yoshida, Ryu
Fukumitsu, et al. “Carotid Artery Plaque Assessment Using Quantitative
Expansive Remodeling Evaluation and MRI Plaque Signal Intensity.” J
Neurosurg, vol. 124, no. 3, pp. 736-742, 2016. View at: Publisher
Site | PubMed
[11]
Xiangyang G, Senhua L “Experimental Study on the
Evolution Law of Calcifying Magnetic Resonance.” Chinese J Radiol, vol.
33, no. 10, pp. 708-712, 1999.
[12]
A Tuenter, M Selwaness, A Arias Lorza, et al. “High
Shear Stress Relates to Intraplaque Hemorrhage in Asymptomatic Carotid
Plaques.” Atherosclerosis, vol. 251, pp. 348-354, 2016. View at: Publisher Site | PubMed
[13]
Academic Year of Department of Neurosurgery in
Zhejiang Province, People’s Republic of China in 2015 and Academic Exchange
Meeting of the Department of Neurosurgery in Four Provinces of Fujian Province
in Zhejiang, China.
[14] Morteza Naghavi, Peter Libby, Erling Falk, et al. “From Vulnerable Plaque to Vulnerable Patient: A Call for New Definitions and Risk Assessment Strategies: Part II.” Circulation, vol. 108, no.15, pp. 1772-1778, 2003. View at: Publisher Site | PubMed
[15] Chinese Society of Cerebral Blood Flow and Metabolism of Stroke Association. Carotid Artery MR Plaque Imaging Techniques, Methods, and Clinical Applications. Chinese Expert Consensus. Shijiazhuang Qinghua University Biomedical Imaging Research Center, People’s Republic of China, 2016.